

EXQUISITEMAD® Case Study: Measurable Surface Gloss Improvement Across Two Bobtail Units
Average gloss increases of 349% and 477%, with both units achieving final averages near 1,200 GU at 20°.
EXQUISITEMAD® documented substantial improvements in measured surface gloss across two serviced units. Before-and-after measurements demonstrate both an increase in average gloss and a complete separation between the plotted baseline and final readings on each unit.
Project Objective
Evaluate the change in surface gloss following refinement through instrument-based measurements. The assessment considers average gloss levels and the distribution of individual readings to provide a documented account of the results.
Measurement Approach
Each unit was evaluated using 15 before-service readings and 16 after-service readings, reported in gloss units (GU) at a 20° measurement geometry.
Average charts summarize the overall change for each unit. Individual-reading charts show the spread of measurements within each sampling group.
Average Gloss Results
Unit 1
Average gloss increased from 264.9 GU to 1,190.4 GU, an absolute gain of 925.5 GU and a 349.4% increase. The final average was approximately 4.49 times the starting average.
Unit 2
Average gloss increased from 207.5 GU to 1,196.7 GU, an absolute gain of 989.2 GU and a 476.7% increase. The final average was approximately 5.77 times the starting average.
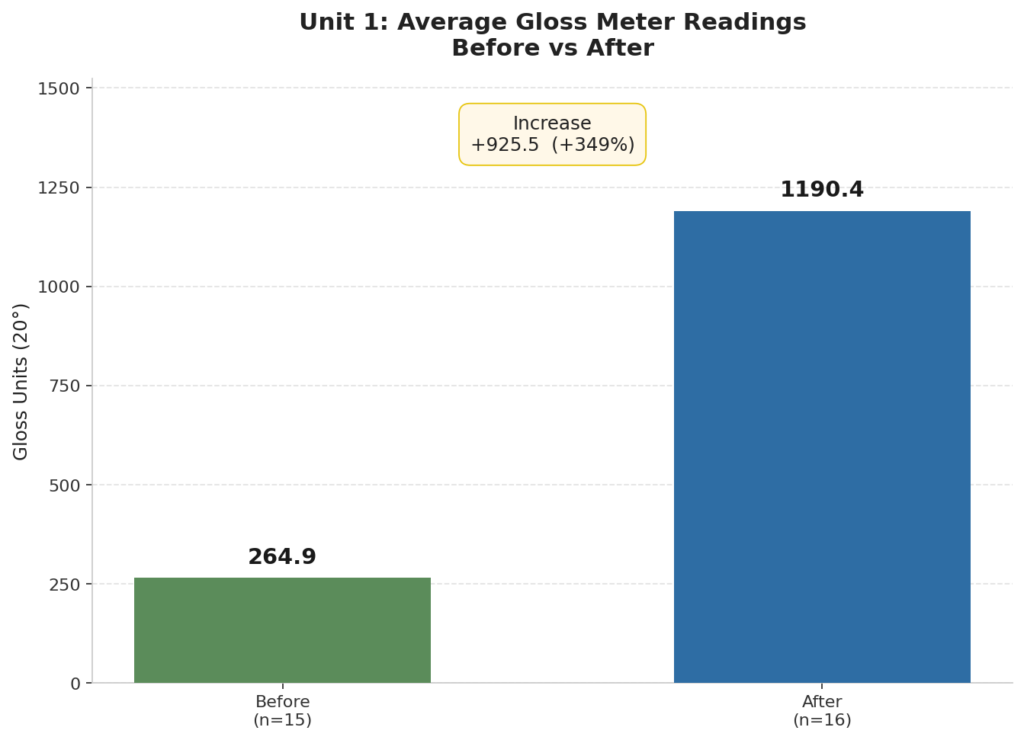
Figure 1. Unit 1 average gloss before and after service: 264.9 GU versus 1,190.4 GU at 20°, representing an increase of 925.5 GU (+349.4%).
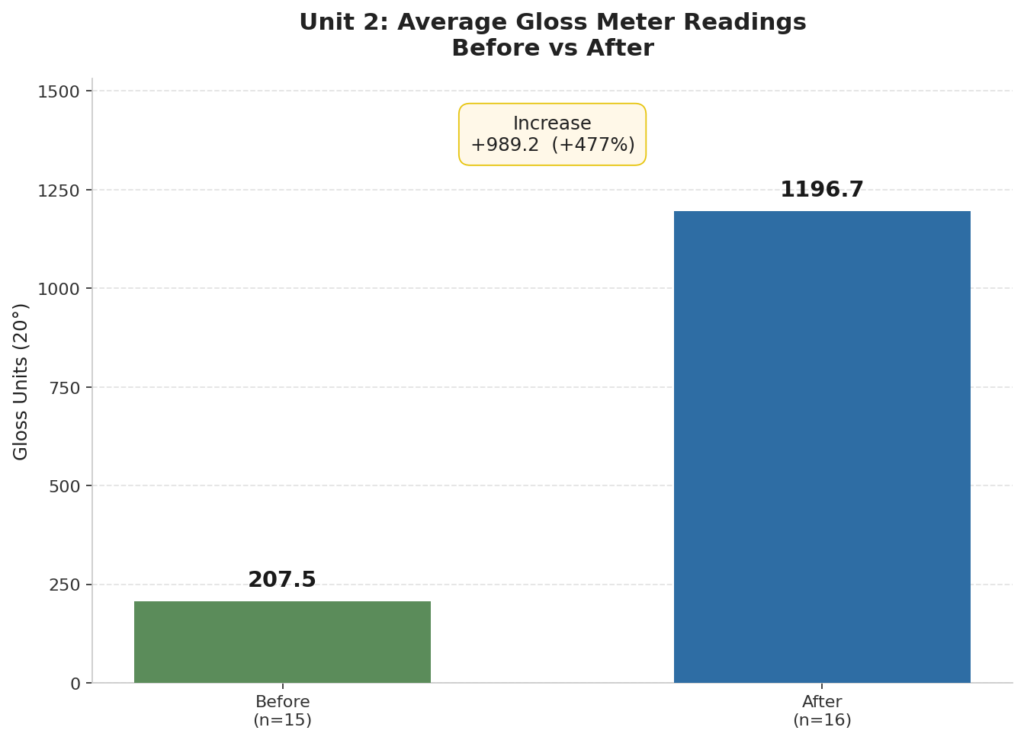
Figure 2. Unit 2 average gloss before and after service: 207.5 GU versus 1,196.7 GU at 20°, representing an increase of 989.2 GU (+476.7%).
Individual Measurement Results
The individual-reading charts provide additional context for the average results. Both units began with a broad spread of baseline measurements, indicating differing levels of gloss across the sampled areas.
Following refinement, every plotted after-service reading exceeded the highest plotted before-service reading on its respective unit. This complete separation demonstrates that the increase in average gloss was accompanied by an upward shift across the sampled readings.
Unit 1: Distribution Before and After Service
Unit 1’s baseline readings ranged approximately from 0 to 490 GU. After service, the plotted readings ranged approximately from 985 to 1,385 GU.
Even the lowest plotted final reading was substantially above the highest plotted baseline reading.
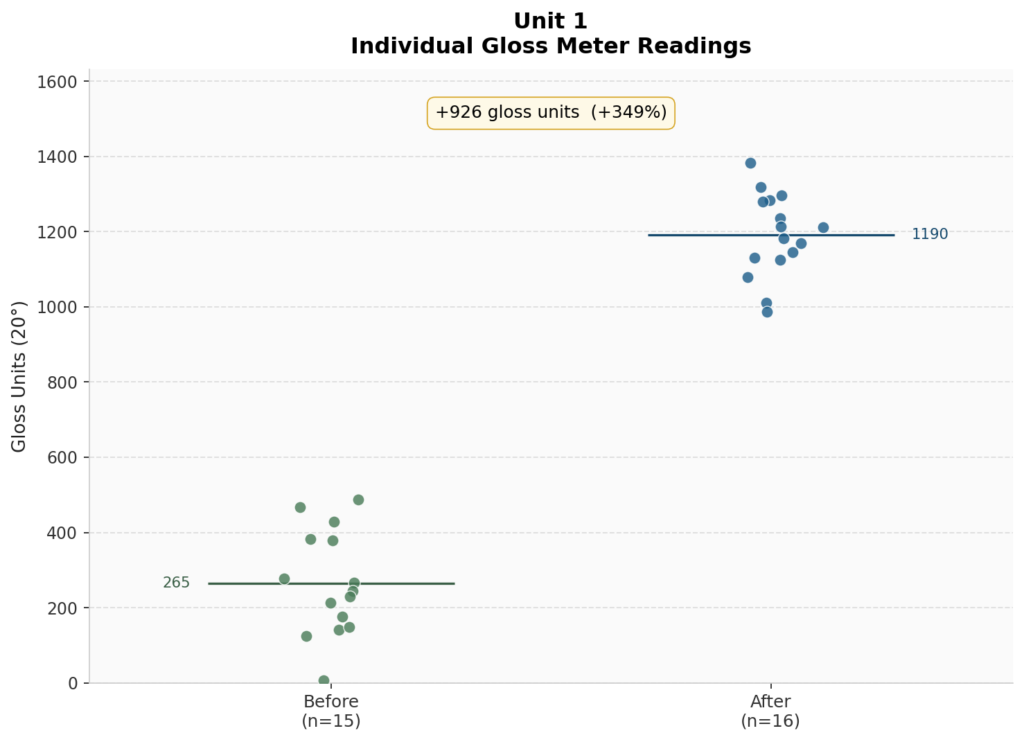
Figure 3. Unit 1 individual gloss measurements at 20°: 15 before-service readings and 16 after-service readings. Horizontal lines indicate group averages.
Unit 2: Distribution Before and After Service
Unit 2’s baseline readings ranged approximately from 0 to 645 GU. After service, the plotted readings ranged approximately from 870 to 1,340 GU.
As with Unit 1, the before-and-after measurement groups showed no overlap in their plotted gloss values.
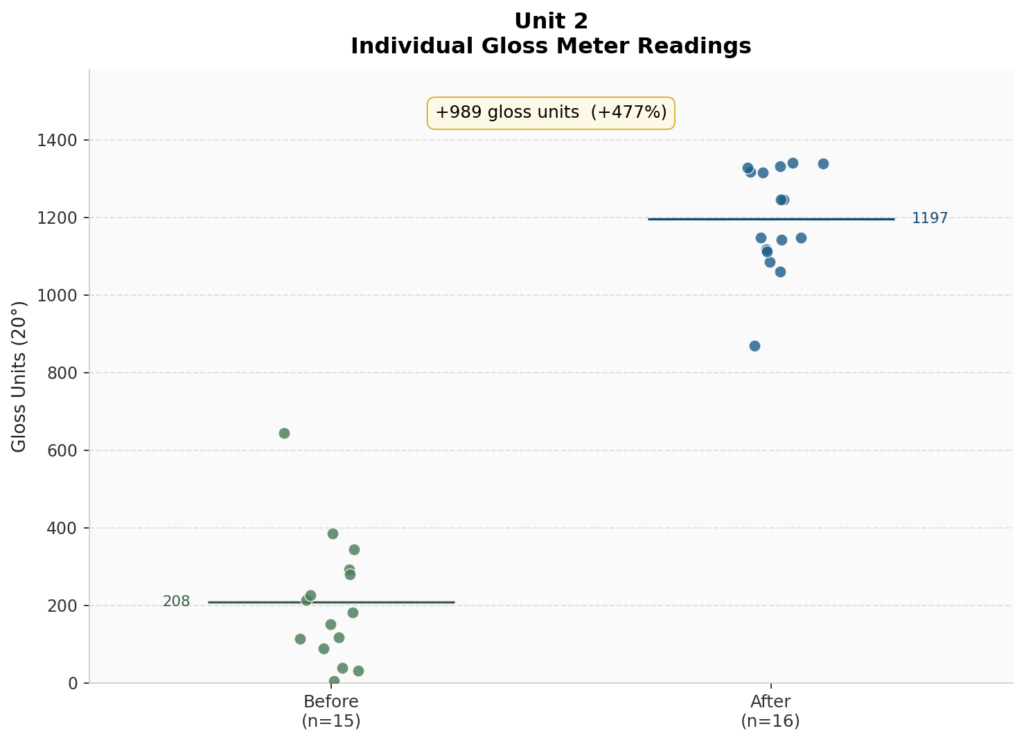
Figure 4. Unit 2 individual gloss measurements at 20°: 15 before-service readings and 16 after-service readings. Horizontal lines indicate group averages.
Comparison of Results
| Performance Measure | Unit 1 | Unit 2 |
|---|---|---|
| Average gloss before service | 264.9 GU | 207.5 GU |
| Average gloss after service | 1,190.4 GU | 1,196.7 GU |
| Absolute increase | 925.5 GU | 989.2 GU |
| Percentage increase | 349.4% | 476.7% |
| Final average relative to baseline | 4.49× | 5.77× |
| Before-service readings | 15 | 15 |
| After-service readings | 16 | 16 |
The starting averages differed by 57.4 GU, while the final averages differed by just 6.3 GU—approximately 0.53% of their shared final mean.
Both units achieved closely comparable average final gloss levels despite different baseline averages. Individual measurements show that local variation remained within each unit.
Significance of the Findings
The four graphs document two complementary aspects of the outcome: the magnitude of the average improvement and the distribution of the sampled readings.
The average charts quantify gains of 925.5 GU and 989.2 GU. The individual-reading charts show that all plotted final measurements exceeded the recorded baseline range for their respective units.
Together, these results provide quantitative evidence of substantial gloss improvement across the sampled areas and support EXQUISITEMAD®’s emphasis on measurable surface refinement produced with proprietary methods and in house engineered products with zero body work, sanding, and or resurfacing.
Measurement Scope
This case study is based on the supplied charts. Percentage changes were calculated from the displayed averages, and approximate measurement ranges were read from the individual plots.
The charts do not identify matched before-and-after measurement locations. Results therefore describe the sampled groups and do not establish the change at each specific location or the condition of every part of either unit.
Gloss units measure specular gloss under the reported measurement geometry; they are not percentages of DOI. These measurements alone do not establish surface roughness, durability, material removal, or structural condition.
Project Outcome
EXQUISITEMAD® achieved average measured gloss increases of 349.4% on Unit 1 and 476.7% on Unit 2, with final averages of 1,190.4 GU and 1,196.7 GU at 20°, respectively.
On both units, every plotted after-service reading exceeded every plotted baseline reading for that unit, documenting substantial improvement throughout the sampled measurement sets.
EXQUISITEMAD®
Safety. Compliance. Preservation. Refinement. Stewardship.